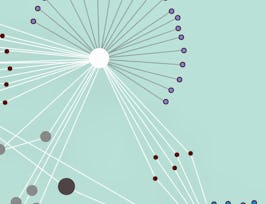
Learn the general concepts of data mining along with basic methodologies and applications. Then dive into one subfield in data mining: pattern discovery. Learn in-depth concepts, methods, and applications of pattern discovery in data mining. We will also introduce methods for pattern-based classification and some interesting applications of pattern discovery. This course provides you the opportunity to learn skills and content to practice and engage in scalable pattern discovery methods on massive transactional data, discuss pattern evaluation measures, and study methods for mining diverse kinds of patterns, sequential patterns, and sub-graph patterns.


Data Visualization
This course is part of Data Mining Specialization
Taught in English
Some content may not be translated

Instructor: John C. Hart
125,253 already enrolled
Included with 
Course
(1,363 reviews)
96%
Details to know

Add to your LinkedIn profile
3 quizzes
Course
(1,363 reviews)
96%
See how employees at top companies are mastering in-demand skills

Build your subject-matter expertise
- Learn new concepts from industry experts
- Gain a foundational understanding of a subject or tool
- Develop job-relevant skills with hands-on projects
- Earn a shareable career certificate


Earn a career certificate
Add this credential to your LinkedIn profile, resume, or CV
Share it on social media and in your performance review

There are 5 modules in this course
You will become familiar with the course, your classmates, and our learning environment. The orientation will also help you obtain the technical skills required for the course.
What's included
6 readings1 quiz
In this week's module, you will learn what data visualization is, how it's used, and how computers display information. You'll also explore different types of visualization and how humans perceive information.
What's included
15 videos2 readings1 quiz1 discussion prompt
In this week's module, you will start to think about how to visualize data effectively. This will include assigning data to appropriate chart elements, using glyphs, parallel coordinates, and streamgraphs, as well as implementing principles of design and color to make your visualizations more engaging and effective.
What's included
11 videos3 readings1 peer review1 discussion prompt
In this week's module, you will learn how to visualize graphs that depict relationships between data items. You'll also plot data using coordinates that are not specifically provided by the data set.
What's included
8 videos3 readings1 peer review1 discussion prompt
In this week's module, you will start to put together everything you've learned by designing your own visualization system for large datasets and dashboards. You'll create and interpret the visualization you created from your data set, and you'll also apply techniques from user-interface design to create an effective visualization system.
What's included
9 videos1 reading1 quiz1 plugin
Instructor

Recommended if you're interested in Data Analysis

University of Illinois at Urbana-Champaign

University of Illinois at Urbana-Champaign

University of Illinois at Urbana-Champaign

University of Illinois at Urbana-Champaign
Prepare for a degree
Taking this course by University of Illinois at Urbana-Champaign may provide you with a preview of the topics, materials and instructors in a related degree program which can help you decide if the topic or university is right for you.
Why people choose Coursera for their career


Learner reviews
Showing 3 of 1363
1,363 reviews
- 5 stars
64.78%
- 4 stars
24.57%
- 3 stars
6.16%
- 2 stars
2.42%
- 1 star
2.05%
New to Data Analysis? Start here.

Open new doors with Coursera Plus
Unlimited access to 7,000+ world-class courses, hands-on projects, and job-ready certificate programs - all included in your subscription
Advance your career with an online degree
Earn a degree from world-class universities - 100% online
Join over 3,400 global companies that choose Coursera for Business
Upskill your employees to excel in the digital economy
Frequently asked questions
Access to lectures and assignments depends on your type of enrollment. If you take a course in audit mode, you will be able to see most course materials for free. To access graded assignments and to earn a Certificate, you will need to purchase the Certificate experience, during or after your audit. If you don't see the audit option:
The course may not offer an audit option. You can try a Free Trial instead, or apply for Financial Aid.
The course may offer 'Full Course, No Certificate' instead. This option lets you see all course materials, submit required assessments, and get a final grade. This also means that you will not be able to purchase a Certificate experience.
When you enroll in the course, you get access to all of the courses in the Specialization, and you earn a certificate when you complete the work. Your electronic Certificate will be added to your Accomplishments page - from there, you can print your Certificate or add it to your LinkedIn profile. If you only want to read and view the course content, you can audit the course for free.
If you subscribed, you get a 7-day free trial during which you can cancel at no penalty. After that, we don’t give refunds, but you can cancel your subscription at any time. See our full refund policy.

